In the wake of global climate change, increasing temperatures and constant rise of environmental health related issue it has become important to regularly monitor and ascertain the changes to urban climate. Doing this at a more precise and regular intervals means even more.
The growth of modern web, internet of things and database technologies which can log real-time data has made this easier and seamless. Taking this as an opportunity, students at the Institute of Geographical Information Systems, NUST have come together to deploy a microclimate monitoring initiative. The initiative is a multi-tier project which includes.

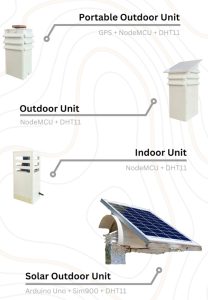
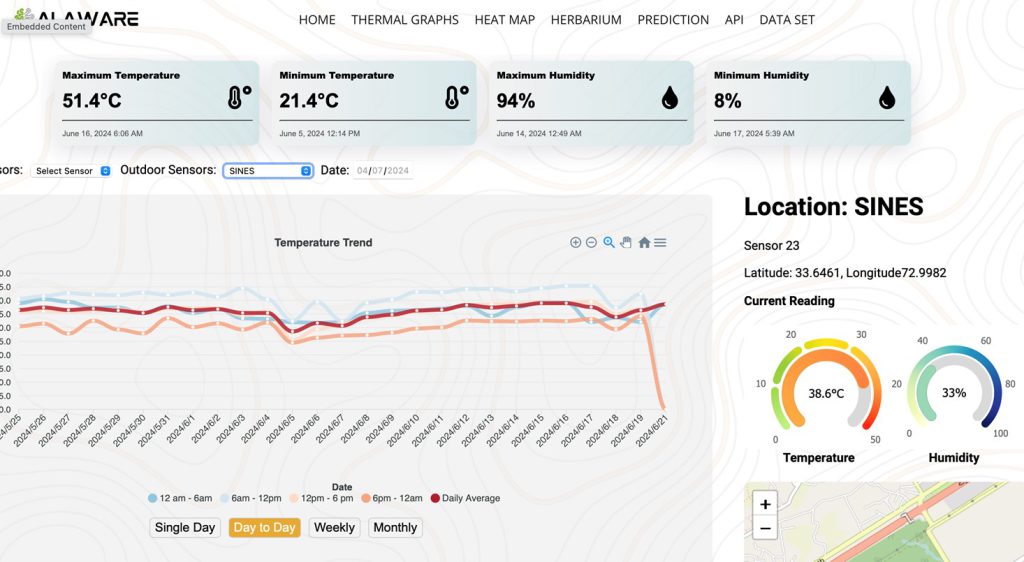
The system works as an integrated geospatial decision-making solution. It has an outdoor unit, that gathers environmental data such as temperature and humidity (scalable to as many variables as desirable). The outdoor unit is connected to the campus Wi-Fi services, which sends the data to a central database. Similarly for the sim-based modules, which are installed in areas not covered by the campus Wi-Fi send data to a dedicated API, which then inserts this data into the central database hosted online. In case a module is off or not sending data, to the central database, the system generates automated alerts and sends an email to the administrator. The database is a geospatially enabled, MySQL database. The database is then connected to a react applications, and a google maps API, where real-time data is displayed as graphs online, and similarly maps high temperature hotspots. In parallel, an android application for taking georeferenced pictures of trees on campus. This application contains form fields, specifying the plant species, their biological nomenclature and sends the collected data to our online folders. From where this data is displayed as a digital herbarium on a map. For the predictive algorithm, extreme Gradient Boosting (XGBoost) has been used, by hyper tuning the parameters so that they learn the underlying relationship between indoor temperature, tree species, distance to building, distance to water bodies, tree density, building density, and outdoor temperature. Once, the data is provided to the model, it can readily predict the ambient effect a tree placement (by type) will have on its neighbourhood.
- IoT devices that can monitor ambient temperature in near real time
- A database that can log information from these devices, over data connections and internet in near real time
- A web portal that leverages this data and displays it in near real-time online
- The portal also has been equipped with georeferenced records of plant types and distribution across the entire NUST campus
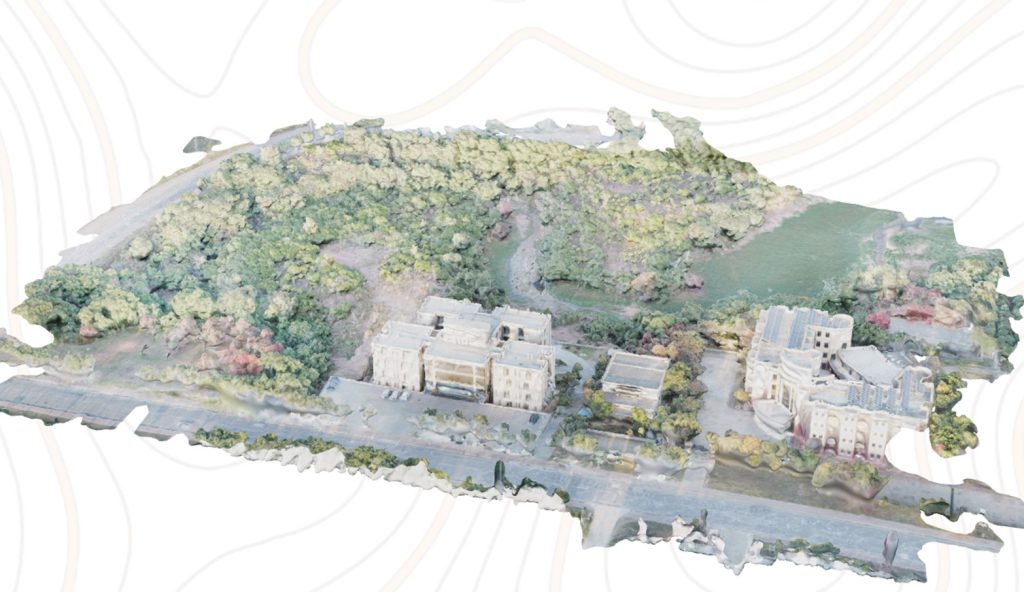
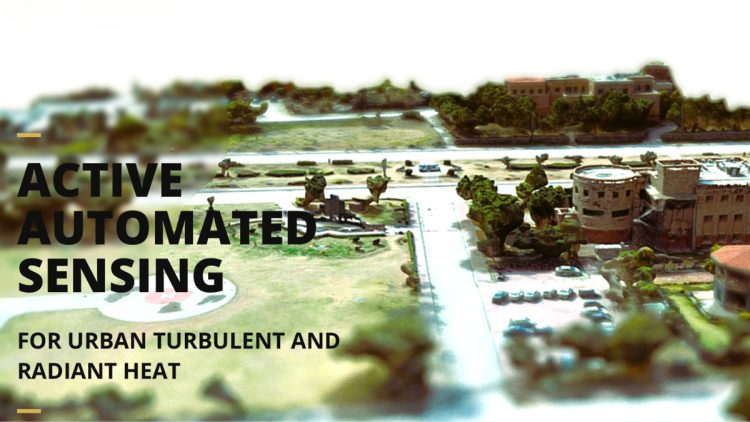
- One important but not available online constituent of the project is a digital replica of the campus. While not fully a twin, it is a 3D model created from more than 12000 drone images collected over the course of a year
- It runs a backend algorithm that allows its users to identify the best suited location for planting new trees and the ambient effect it will have on temperature

The research incorporates a nouvelle microclimate monitoring approach, which is cost effective, efficient and real-time. While there are several portals and projects, that use mapping, there are a few, in the current working phase, which have real-time sensor data gathered and made available to the public. For instance, large corporations, do provide spatial weather data online, but with advertising revenue-based widgets popping up on their websites, or with subscription-based models. This, however, remains free for all and is meant to expand to more than 100 microclimate regions of Pakistan. The sensor density per unit area is high and caters to both indoor and outdoor environments and incorporates three dimensional models of the installed areas.
In the past spatial data was meant to be collected manually. Cartographers were known to rely heavily on existing data, or data collectors from other fields of sciences, such as surveying, health, meteorology, mining, geology etc. According to one famous geographer Edson (1979: 165);
Cartography is the totality of scientific/technical and artistic activities aiming at the production of maps and related presentations on the basis of data (field measurements, aerial photographs, satellite imagery, statistical material, etc.) collected by other disciplines. Furthermore, cartography includes the study of maps as scientific documents as well as their use. In this sense, cartography is limited to ‘Cartography proper’, i.e., to data presentation up to the reproduction and printing of maps and charts: it will be understood that in the practical application of this definition, the gathering of primary data, field surveying and photogrammetry are excluded as are surveys carried out by other disciplines such as geology, statistics, demography, etc.

However, with the advent of Internet of things, and connected devices, this has massively changed. Now data from the fields can be collected without any human intervention and shared online, for a broader audience. The data at the same time can be processed to present a meaningful picture. Hence, reducing the need for the readers/consumers to process information or analyse it. This later is good for novice users of such data, or for individuals who are not from the main field.
The project can be used at large by data analysts, urban managers, planners, municipal administrators and housing societies. The project can be scaled to map, real-time weather conditions in far and remote areas, indoor monitoring of environmental health in remote locations and combined with other variables for occurrence analysis of pests and insects. Since many pests and insects tend to thrive in a given set of environmental conditions.
The portal can be accessed live on www.aiaware.com.pk.
Edson, D. (1979) The International Cartographic Association – An overview. In Proceedings of the International Symposium on Cartography and Computing: Applications in Health and Environment, Reston, Virginia, pp. 164–167.
The author is an Associate Professor in the School of Civil and Environmental Engineering, National University of Sciences and Technology (NUST). He can be reached at salman@igis.nust.edu.pk.
Research Profile: https://bit.ly/3LdBPLw

![]()


