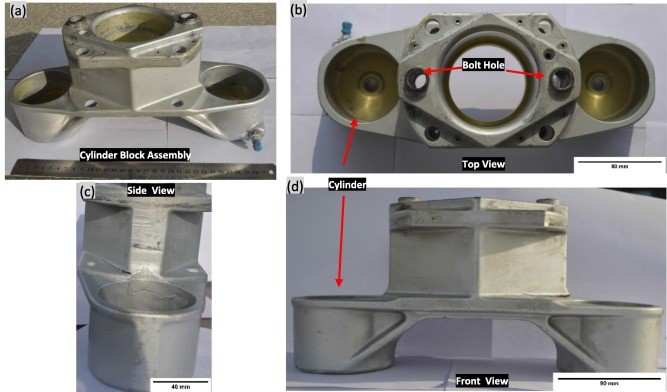
 The research contains the analysis of a cylinder block assembly of an aircraft brake system that failed due to the formation of cracks. The failure analysis was performed using a two-prong strategy (i) experimental, which included the analysis of the fracture surfaces along with microstructure and composition, and (ii) numerical (finite element analysis, FEA), to find the stress state. Visual inspection revealed relatively long cracks emanating from a sharp corner (junction) which traversed 87 mm in one direction and 52 mm in another. At a mirror-symmetric location, another smaller crack (~16 mm) revealed the initial growth stage. During detailed fractography of the region containing long cracks, clear beach marks indicating progressive failure were observed pointing towards the same sharp corner. Microstructure and compositional analysis revealed the cylinder block assembly material to be heat treated Al 2024 having no inherent nonconformities. The hardness was also found to be conformant to the typical of the Al 2024. The stresses are produced as a consequence of (a range of) hydraulic pressures acting on its pistons which were estimated using FEA. The stress was confirmed to be concentrated (having Kt ~ 2.25) at the same junction(s) as identified during fractography. Due to the cyclic nature of the applied loads, the resulting stresses initiated the fatigue crack(s) at the stress concentration locations (junctions). Fatigue life calculation using unnotched SN diagram (Kt = 1, R ~ 0) showed that failures could potentially occur between 2.83 E5 to 1.12 E5 load cycles, depending on the value of stress amplitude, and it matched with the estimated life in our case. Thus, a combination of cyclic brake applications and the presence of stress concentration locations resulted in fatigue crack initiation and propagation leading to the ultimate rejection of the cylinder block.
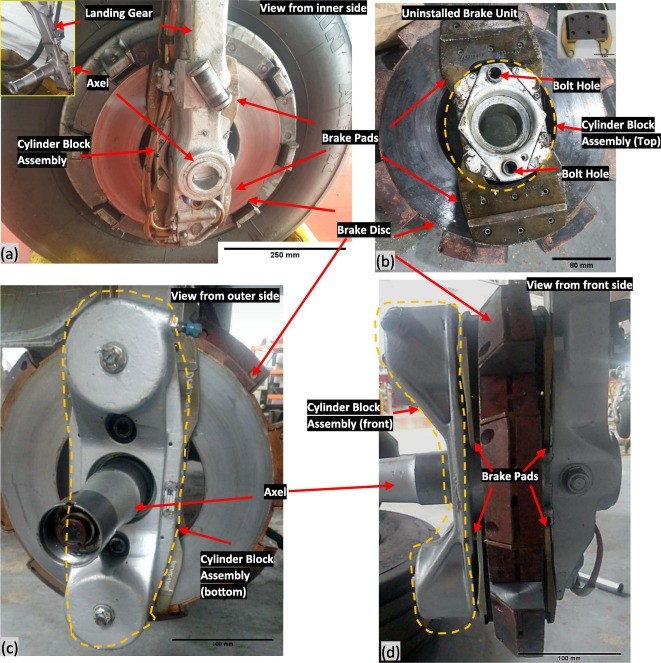
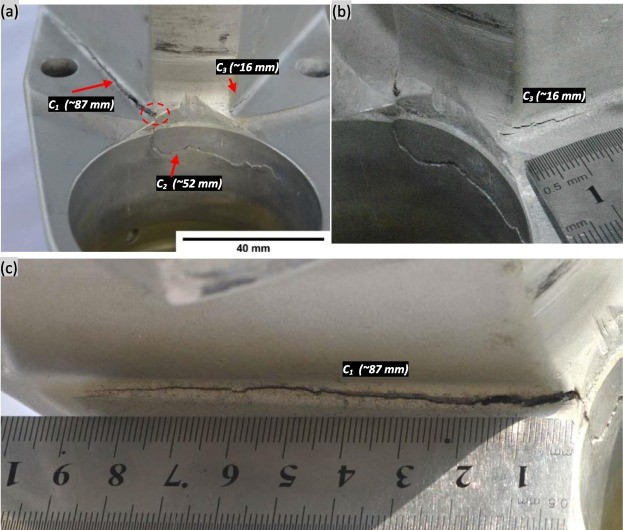
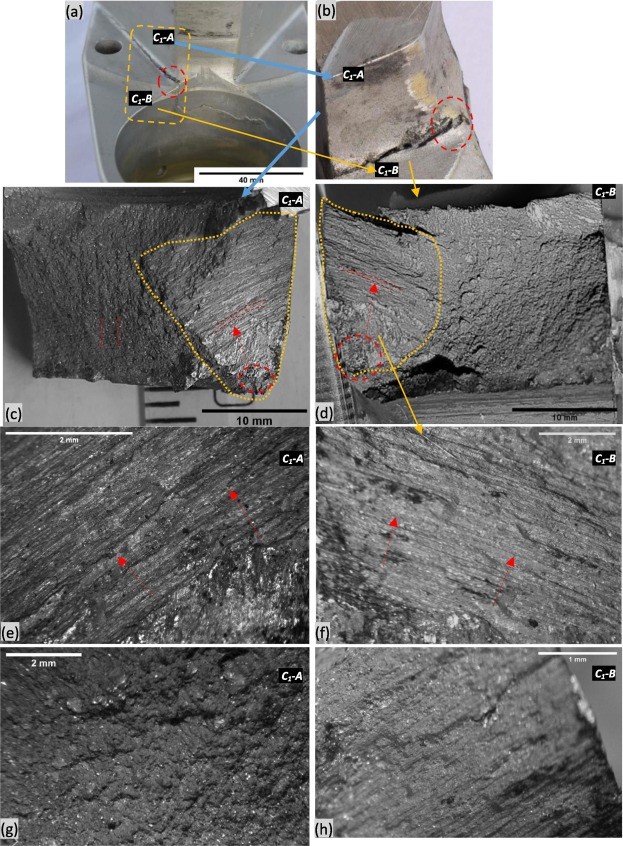
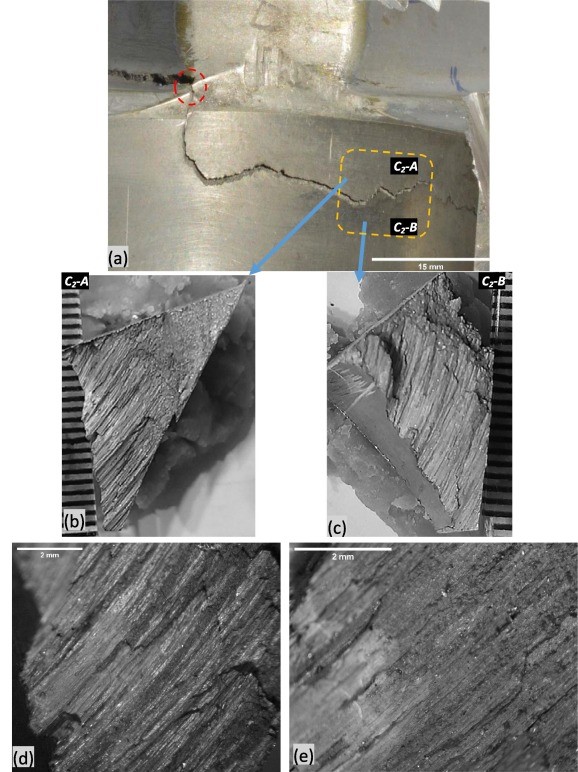
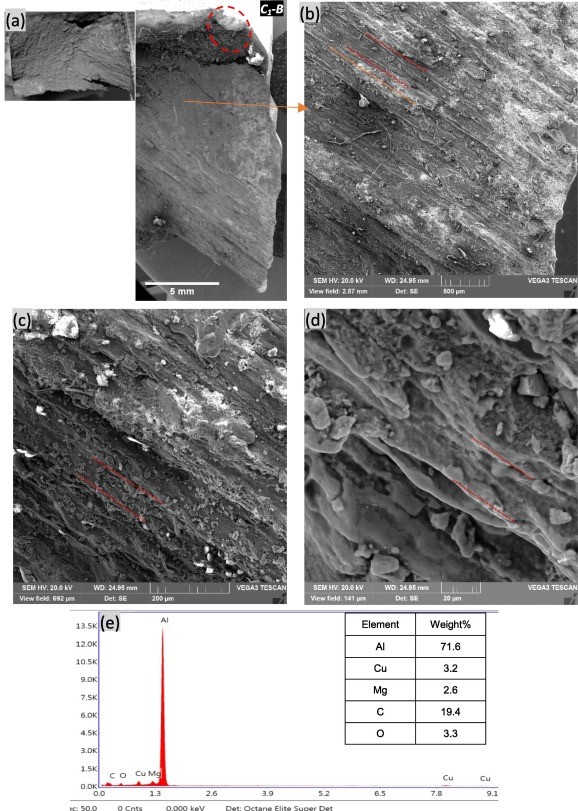
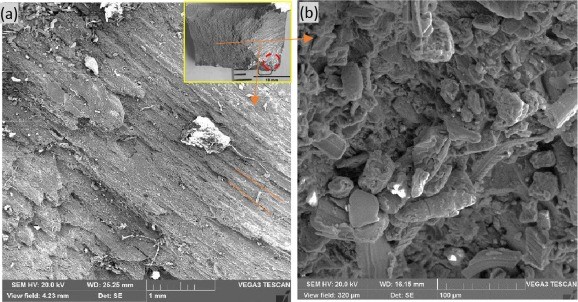
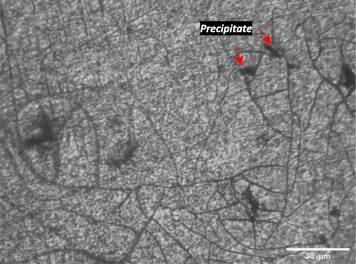
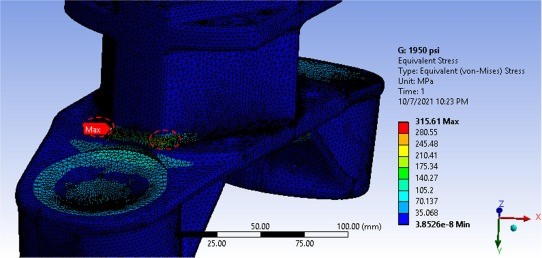
No inclusions or nonconformities were found to be present and microstructure was found to be heat treated Al 2024 alloy having an equivalent tensile strength of ~>500 MPa. The complete fractographic analysis pointed out towards the fatigue failure emanating from a junction of two side walls and a base (highlighted with dashed circles in Figs. 5-8) which was a stress concentration site. Moreover, the small (~16 mm) crack C3 on the opposite wall exactly showed how the early stages of crack growth would appear as the C3 initiated from the mirror-symmetric stress concentration location (to C1). The computational stress analysis in ANSYS ® helped to identify the stresses in the cylinder assembly corresponding to nominal hydraulic braking pressure (the complete range of values is analysed in Table 2). Additionally, the stress analysis confirmed the location of the stress concentration site (Kt ~ 2.25) for the cylinder block assembly which exactly matched with the same junction as identified in the fractographic analysis. On examining the history of similar failures on the aircraft type it was found that failures from the same location have also been observed in the past. In fact, in the past five years, a total of ten such cases were reported in which the cracks have been observed on cylinder block assemblies at similar locations. In all previous cases, the failures had occurred between the first overhaul (1650 landings) and the second overhaul (3300 landings). However, no ‘throwaway’ life is recommended by the manufacturer thus the failures cannot be called ‘premature’.
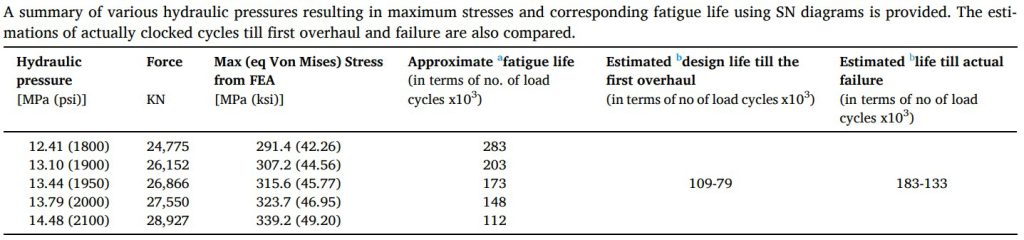
Rice et al [12] which approximates the unnotched SN diagrams (Kt = 1.0, R ~ 0) for Al 2024-T3 alloy (having a similar tensile strength as of the understudy brake unit) to estimate the component life. LogNf = 11.1 − 3.97log(S − 15.8) (5) where Nf are the failure cycles and S is the stress amplitude in ksi. Subsequently, fatigue life(s) for various values of brake pressure (corresponding to the maximum stress) were obtained. As hydraulic pressure values vary from 12.41 to 14.48 MPa the corresponding stresses range between 291 and 339 MPa. The corresponding fatigue life from the unnotched SN diagram was estimated to be between 283 to 112 (x 103) stress cycles (refer Table 1, Column 4) furthermore the higher stresses result in a lower life. The range is not only comparable to but also encompasses the counted cycles till one overhaul [109–79 (x 103)] as shown in Table 1 (Column 5). The failure, in the present study, occurred after 2776 landings which correspond to 183–133 (x 103) stress cycles (Table 1, Column 6). Even if the partial cycles are considered at this juncture, their peak hydraulic pressures are very low owing to the fact that they are used for differential braking for turning and requires ‘a touch on the brake pedal’ in the words of operators. A conservative assumption for the peak value of hydraulic pressure during the partial cycle entails 35% of the value during a full cycle. The corresponding stress value (120 MPa) estimates a fatigue failure at 2×10¹⁰ cycles which even from a damage accumulation model perspective results in a negligible effect for all the partial cycles till failures. Thus, the (cyclic) brake applications coupled with the antiskid system, and the presence of two stress concentration sites in the cylinder block cause the fatigue crack initiation and subsequent growth till failure/rejection of the component. The presence of stress concentration locations is a design flaw that could have been identified by the manufacturer during the design phase.
Cylinder block assembly failed due to fatigue whereas no anomaly related to material strength or composition was observed. Hydraulic pressure variations between zero to maximum value amid brake application and antiskid operation result in stress cycles. The design flaw in the form of a stress concentration site raises the stress value to result in fatigue crack initiation and propagation.
References:
[1] B.H. Anderson, W.C. Kreger, Aircraft Antiskid Performance and System Compatibility Analysis, General Dynamics Fort Worth Tx Fort Worth Div, 1971.
[2] J.J. Barnett, A.P. Simmons, J.M. Firth, A.N. Cable, J.R. James, Aircraft Accident Report No: 6/2007, 2007.
[3] Y. Wang, B. Gao, W.L. Woo, G. Tian, X. Maldague, L.i. Zheng, Z. Guo, Y. Zhu, Thermal pattern contrast diagnostic of microcracks with induction thermography for aircraft braking components, %J. IEEE Trans. Ind. Inf. 14 (12) (2018) 5563–5574.
[4] Z. Mehmood, A. Hameed, A. Javed, A. Hussain, Analysis of premature failure of aircraft hydraulic pipes, Eng. Fail. Anal. 109 (2020), 104356.
[5] A. Hameed, O. Zubair, T.A. Shams, Z. Mehmood, A. Javed, Failure analysis of a broken support strut of an aircraft landing gear, Eng. Fail. Anal. 117 (2020), 104847.
[6] V. Infante, L. Fernandes, M. Freitas, R. Baptista, Failure analysis of a nose landing gear fork, Eng. Fail. Anal. 82 (2017) 554–565.
[7] Z. Mehmood, A. Hameed, S. Safdar, F. Siddiqui, Multiaxial stress mapping and fatigue failure prediction of aircraft hydraulic pipes, Eng. Fail. Anal. 121 (2021), 105168.
[8] A.I.H. Committee, ASM Handbook, Volume 1: Properties and Selection: Irons, Steels, and High-Performance Alloys, 1990.
[9] A.I.H. Committee, ASM Handbook Volume 2: Properties and Selection: Nonferrous Alloys and Special-Purpose Materials, 1990.
[10] A. International, ASTM A370-19e1 Test Methods and Definitions for Mechanical Testing of Steel Products, ASTM, West Conshohocken, 2019.
[11] R.G.B.K.J. Nisbett, Shigley’s mechanical engineering design, 9 ed., McGraw-Hill Education, 2011.
[12] R. Richard C, J. Jana L, B. John, T. Steven, Metallic Materials Properties Development and Standardization (MMPDS), 2003
The author is Associate Professor and Training Coordinator at Department of Aerospace Engineering, College of Aeronautical Engineering, National University of Sciences & Technology (NUST). He can be reached at [email protected].